The digital ad spend, covering desktops, laptops, and mobile devices, reached an estimated 522.5 billion U.S. dollars in 2021. [1] This amount is projected to experience consistent growth in the upcoming years, with a forecasted total of 835.82 billion U.S. dollars by 2026. This article aims to provide insights into digital ad spend growth, including its current and future outlook.
Summary
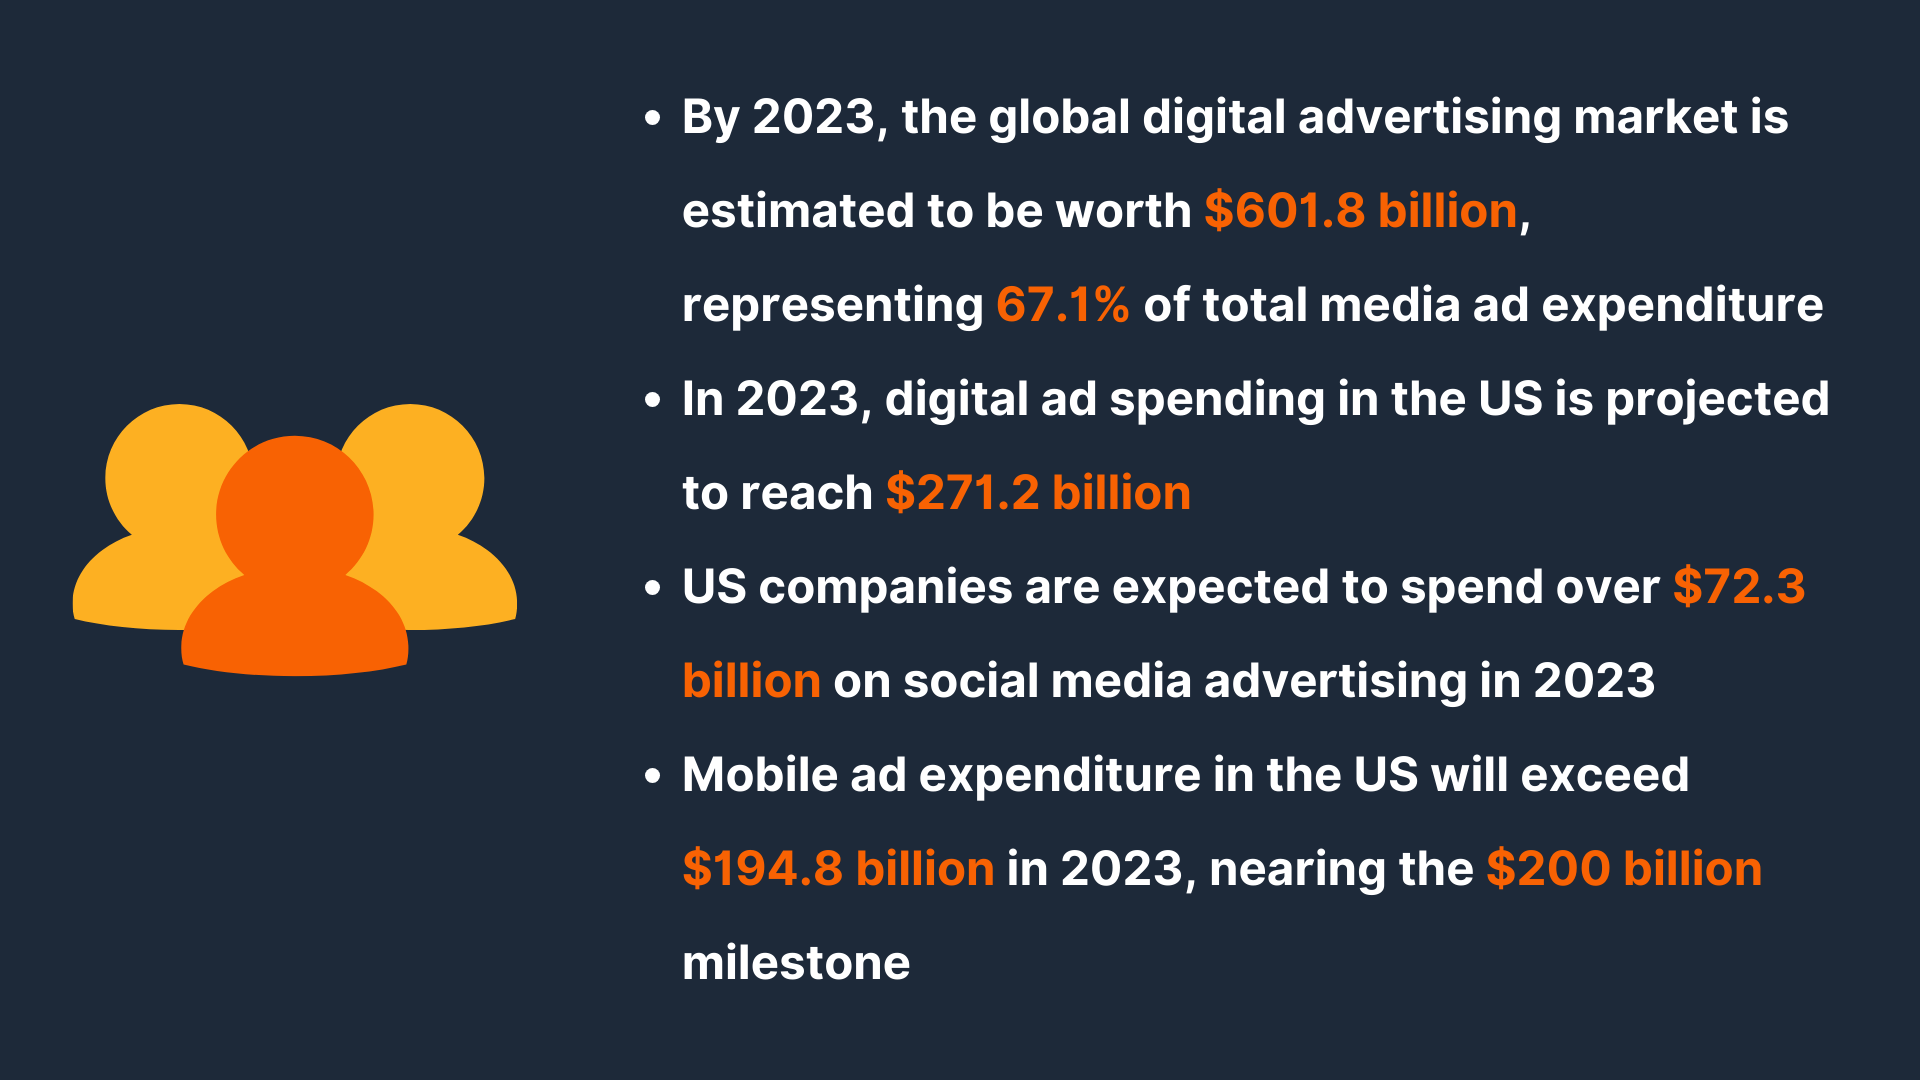
- By 2023, the global digital advertising market is estimated to be worth $601.8 billion, representing 67.1% of total media ad expenditure.
- Retail accounts for about 22% of digital ad spend. From Internet classifieds to display ads, digital ad spend is surpassing traditional methods.
- The US leads in ad spending, with an impressive $197.47 billion invested, surpassing other nations.
- In 2023, digital ad spending in the US is projected to reach $271.2 billion.
- US companies are expected to spend over $72.3 billion on social media advertising in 2023.
- Mobile ad expenditure in the US will exceed $194.8 billion in 2023, nearing the $200 billion milestone.
Total Digital Ad Spend
By 2023, the worldwide digital advertising market is estimated to be worth $601.8 billion, accounting for 67.1% of the total expenditure on media advertisements. This information is sourced from Insider Intelligence.[2,3]
The graph above illustrates the year-on-year trajectory of global digital ad spending, highlighting a consistent upward trend.
The graph’s spikes underscore the significant influence of digital platforms on contemporary advertising strategies. Digital marketing is the primary advertising medium in several countries, including the US.
Industry-Wise Digital Marketing Ad Spending
The digital marketing statistics and trends mentioned above provide valuable insights into where to focus your time and resources. The graph above illustrates the division of digital ad spending within different industries:
- Retail leads the way, accounting for approximately 22% of total digital ad spend.[4]
- Automotive and Financial Services follow closely, each contributing around 12% to the total spend.
- Travel and Leisure, and Consumer Packaged Goods, each account for about 8% of total ad expenditure.
- Other industries collectively make up the remaining 38% of digital advertising expenditure.
Projected Ad Spend Growth Worldwide
The chart above illustrates the projected growth in worldwide digital ad spending. It showcases the increasing importance of digital advertising, with a consistent upward trend in global expenditure.
From Internet classified ads and paid search campaigns to Internet display advertising, digital ad spend is rapidly gaining traction and gradually overshadowing traditional advertising methods.
As businesses recognize digital platforms’ immense reach and targeting capabilities, they increasingly allocate their marketing budgets toward online channels to effectively engage their target audiences and maximize their return on investment.
With the ability to measure and analyze campaign performance in real-time, digital advertising offers unparalleled insights and opportunities for optimization, making it an indispensable component of modern marketing strategies.
2022 Digital Ad Spending Country-Wise
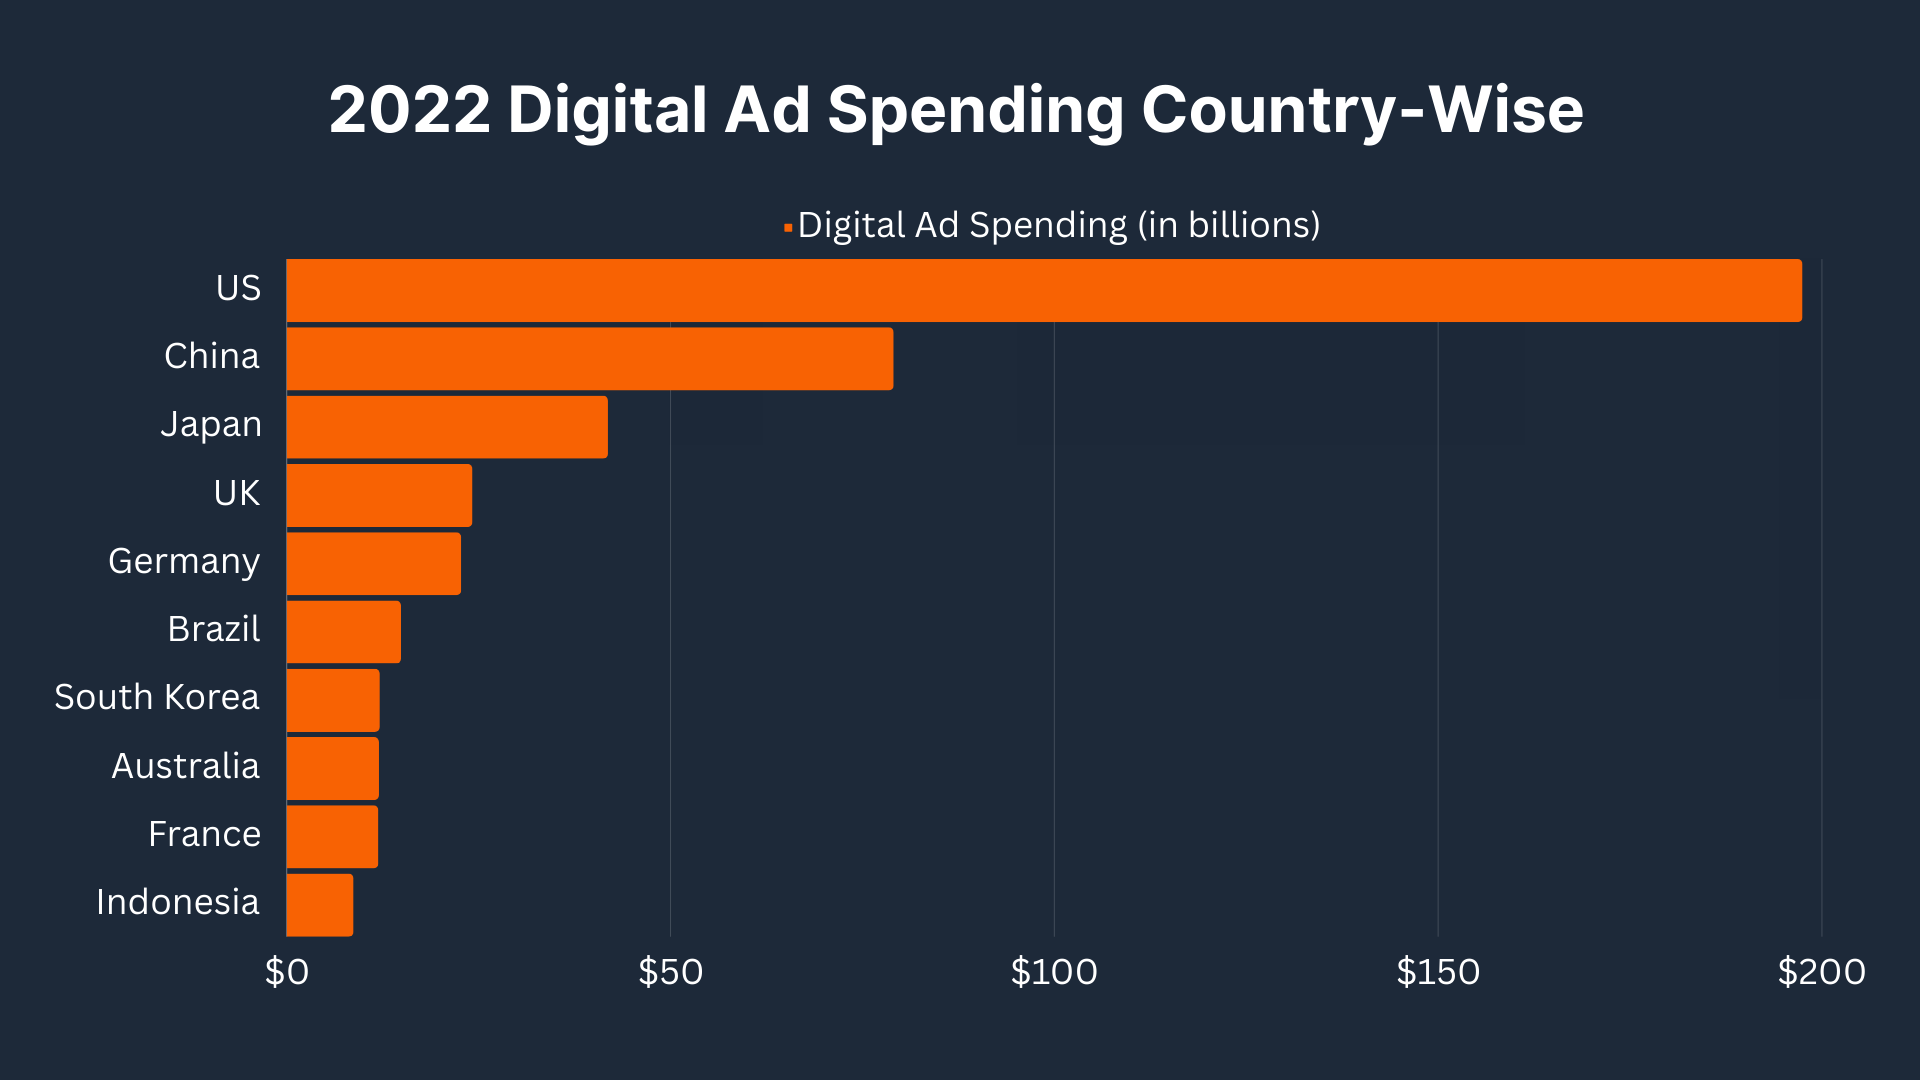
| Sr No. | Country | Digital Ad Spending (in billions) |
| 1 | US | $197.47 |
| 2 | China | $79.08 |
| 3 | Japan | $41.85 |
| 4 | UK | $24.21 |
| 5 | Germany | $22.74 |
| 6 | Brazil | $14.89 |
| 7 | South Korea | $12.13 |
| 8 | Australia | $12.02 |
| 9 | France | $11.95 |
| 10 | Indonesia | $8.71 |
Digital marketing has become the primary advertising medium in certain countries, such as the US. According to data provided by Statista, the US leads the way in advertising spending, with a staggering $197.47 billion invested, surpassing other nations.[5]
With a surge in digital and mobile users, both Indonesia and India have become hotspots for rapid growth. Indonesia has claimed the title of the world’s fastest-growing digital advertising market, closely followed by India.
US Digital Ad Spending
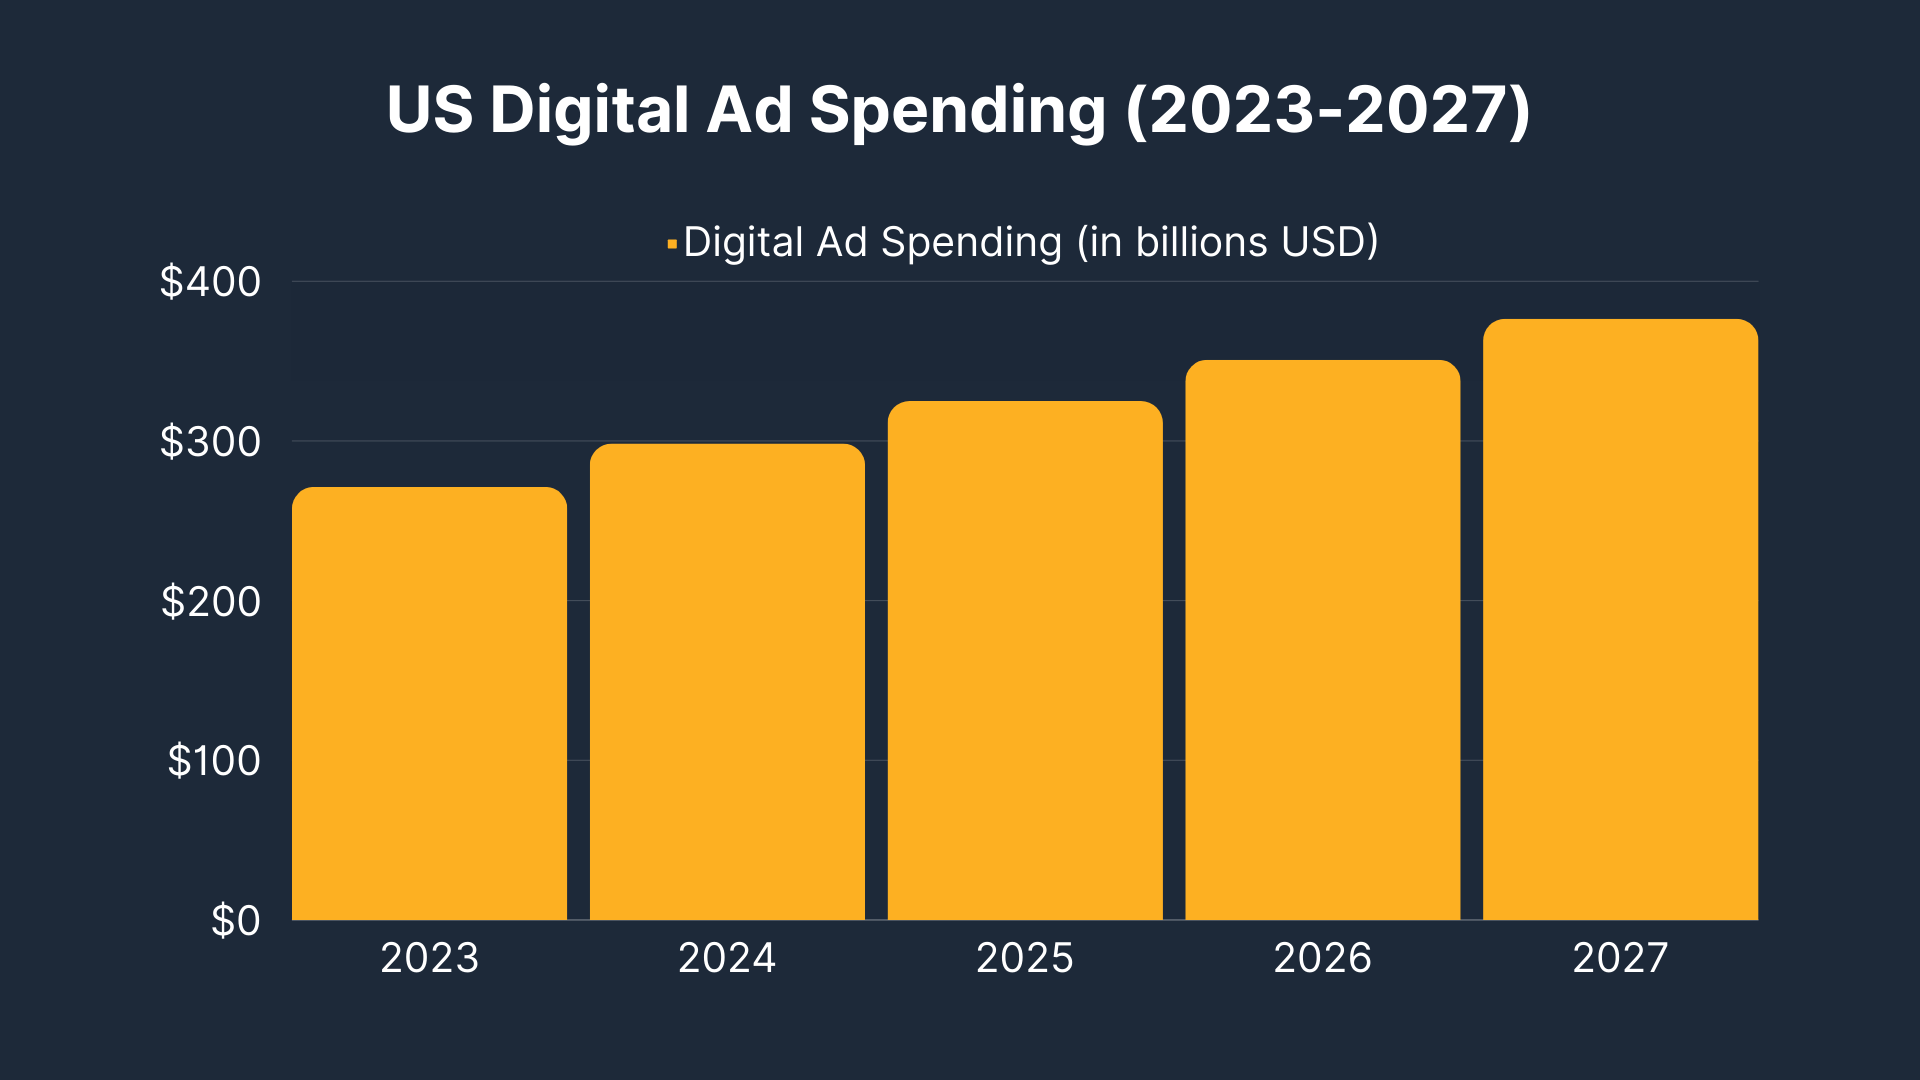
In 2023, digital advertising spending in the United States is projected to reach $271.2 billion, as per the latest data.[6] This represents an 11.2% growth compared to the previous year when spending amounted to $243.9 billion.
According to forecasts, US digital advertising spending will steadily increase in the coming years. It is projected to reach $298.4 billion in 2024 [7] and grow to $325 billion in 2025, surpassing the $400 billion mark for the first time. The estimate for 2026 is $350.9 billion, and experts predict it will reach $376.5 billion in 2027.
In 2023, it is projected that each internet user in the US will spend approximately $869 on digital advertising. This represents a 9.5% growth compared to the previous year.
Similar to the size of the digital advertising market in the United States, the amount spent per user has also been increasing in recent years. In 2017, the average US digital ad expenditure per internet user was $319.40. Over the period from 2017 to 2023, this figure nearly tripled.
Social Media Ad Spend (2017–2027)
Estimates suggest that US companies will spend over $72.3 billion on social media advertising in 2023.[8] This reflects a projected growth rate of 8.52% compared to the previous year, surpassing the 5.6% increase in social media ad spend.
From 2018 to 2021, the US witnessed a remarkable 31.11% annual growth in social media advertising expenditure, which is almost four times higher than the anticipated growth rate for this year. However, when considering the years 2022 and 2023, the average annual growth rate from 2018 to 2023 decreases to 23.09%.
As the number of social media users in the US is expected to reach 246 million by 2023 and continues to grow, it is no surprise that brands are placing more emphasis on social media advertising.[9]
Furthermore, people’s time on social media has been increasing. This means your social media ads are more likely to get noticed. By 2023, the average internet user in the United States will spend approximately two hours and 16 minutes daily using social media platforms.
Mobile Advertising Growth (2020-2025)
Based on the most recent data from Statista, mobile advertising expenditure in the United States is projected to surpass $194.8 billion in 2023, approaching the significant milestone of $200 billion. This represents a 14.5% year-on-year growth rate, indicating a slight decrease compared to the 18.2% growth rate observed in 2022.[10,11]
Over the past few years, there has been a significant increase in spending on mobile advertisements. In 2020, the expenditure reached $103.4 billion, and it rose by a remarkable 39.2% in 2021, reaching $144 billion. The following year, the size of the mobile ad market expanded further to $170.1 billion.
Conclusion
The upward trend in digital ad spend, particularly in social media and mobile advertising, is an unmistakable testament to the digital age we live in. As technology evolves, brands continue to leverage these platforms to reach a wider audience, thus significantly influencing the advertising landscape. The future of digital ad spending promises further growth and evolution, paving the way for more innovative advertising strategies.
References
- https://www.statista.com/statistics/237974/online-advertising-spending-worldwide/#:~:text=Digital%20advertising%20spending%20worldwide%20%E2%80%93%20which,billion%20U.S.%20dollars%20by%202026.
- https://www.insiderintelligence.com/content/digital-ad-spend-worldwide-pass-600-billion-this-year
- https://www.oberlo.com/statistics/digital-ad-spend
- https://www.softwaresuggest.com/blog/global-digital-ad-spending-research/
- https://www.brafton.com/blog/content-marketing/the-ultimate-list-of-marketing-spend-statistics-for-2019-infographic/
- https://www.statista.com/outlook/dmo/digital-advertising/united-states#ad-spending
- https://www.oberlo.com/statistics/us-digital-ad-spending
- https://www.statista.com/outlook/dmo/digital-advertising/social-media-advertising/united-states#ad-spending
- https://www.oberlo.com/statistics/social-media-ad-spend
- https://www.statista.com/statistics/269916/mobile-advertising-spending-in-the-united-states/
- https://www.oberlo.com/statistics/mobile-advertising-growth